What Should Be in a Monthly SEO Report?
A useful monthly SEO report connects search visibility to qualified leads, explains meaningful changes, records completed work, and assigns the next decisions and actions.
The direct answer
A monthly SEO report should answer five questions: What business outcome are we trying to improve? What changed in search visibility and organic traffic? Which landing pages and queries drove that change? Did the traffic produce real calls, forms, bookings, or sales opportunities? What should happen next, who owns it, and when will it be checked?
The report should combine Google Search Console, website analytics, lead or CRM evidence, Google Business Profile performance when local search matters, and a short record of work completed. It should separate observations from explanations. A drop in clicks is an observation; seasonality, a technical failure, a search update, weaker click-through, or lost demand are possible explanations that need evidence.
Keep the executive summary short enough for an owner to use. Put detailed query exports, crawl results, and issue lists behind the summary. A polished dashboard that cannot support a decision is not a useful report.
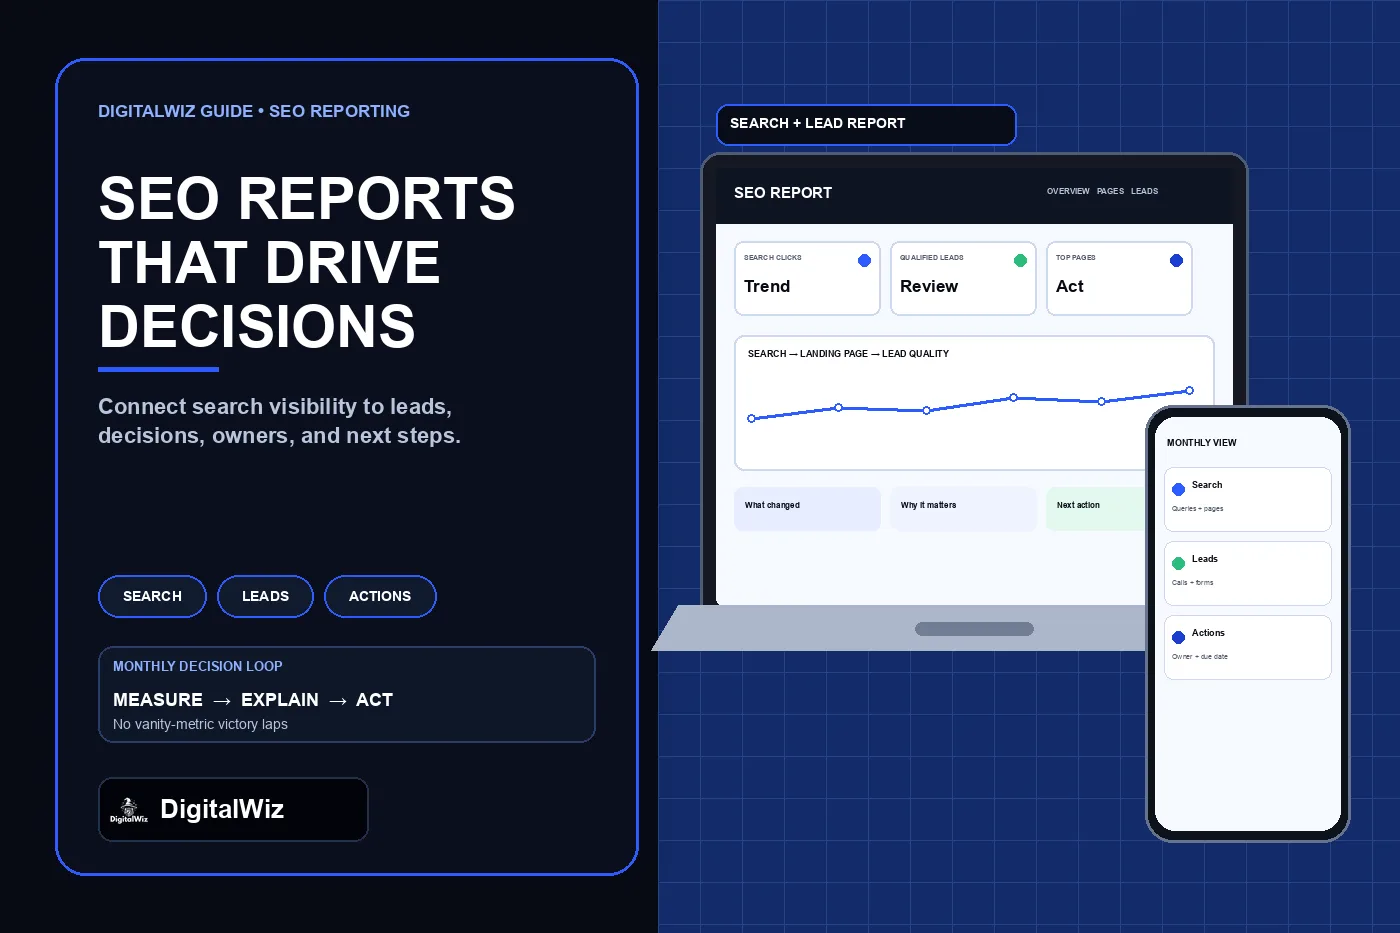
Illustrative reporting interface, not a client account, measured result, or performance claim.
- Business goal and reporting period
- Search visibility and landing-page trends
- Qualified lead and outcome evidence
- Completed work, open risks, and measurement limits
- Prioritized next actions with owners and due dates
Start with the decision, not the dashboard
Define the decision the report must support before choosing charts. A contractor may need to decide whether to improve a high-impression service page, repair lead tracking, strengthen a weak location path, publish a missing answer, or leave a seasonal fluctuation alone. Those are different decisions and need different evidence.
Name the primary business outcome in plain language: qualified estimate requests, booked consultations, calls that match the service area, online purchases, or another verified action. Then state the supporting search measures. Rankings, impressions, clicks, engagement, and indexed pages can explain progress, but they are not interchangeable with revenue or lead quality.
Use one executive block at the top: reporting period, goal, the two or three material changes, the main risk, and the next priority. Avoid declaring a win because one metric rose. More impressions can reflect broader visibility, brand demand, a new low-intent query, seasonality, or a reporting change. Connect the number to pages, queries, actions, and business outcomes before interpreting it.
Use consistent dates and label the comparison
A percentage without a clearly defined comparison is easy to misread. State the exact current and comparison dates, timezone when it matters, and whether the data is complete. Use full calendar months for ordinary monthly reporting. Add a year-over-year comparison for seasonal businesses when enough history exists, but do not mix a 30-day window with a shorter partial month.
Google's Search Console Performance report documentation explains that the report can show clicks, impressions, click-through rate, and average position by query, page, country, device, search appearance, and date. It also notes that chart and table totals can differ because of aggregation. Preserve the filters and grouping used for every reported number.
Search Console's newest data can be preliminary, and Google Business Profile search-query data may take several days to appear at the start of a month. If a source is incomplete, label it pending instead of treating a blank as zero. Keep the same property, search type, country, device, and brand-filter rules between periods so the comparison retains its meaning.
- Current period and comparison period
- Property, channel, country, device, and search-type filters
- Brand versus non-brand rule, if used
- Data extraction date and any incomplete source
- Known tracking or attribution changes during the period
Report search performance by query and landing page
Show total organic clicks and impressions as context, then break meaningful movement down by landing page and query group. A sitewide average can hide a service page losing demand while an unrelated article gains traffic. Pair the pages that gained or lost clicks with the queries behind the change and the customer intent those queries represent.
Treat click-through rate and average position carefully. Search Console defines CTR as clicks divided by impressions and average position as the average position of the topmost result for the selected grouping. These are useful trends, not fixed rankings for every searcher. Search results vary by time, place, device, and history, so a monthly report should not present one average as a guaranteed placement.
For each material page, report the change, the likely intent, and the next action. Rising impressions with flat clicks may justify reviewing the title, snippet, search appearance, or intent match. Falling impressions and clicks across a query group may reflect demand, indexing, technical issues, competition, or search changes. Google's traffic-drop guide recommends checking the pattern, affected pages and queries, technical and security issues, search updates, and seasonality before making radical changes.
Do not turn every low-volume fluctuation into a task. Use thresholds appropriate to the site, annotate launches and outages, and prioritize movements large enough to change a business or publishing decision.
Connect organic traffic to qualified leads
Search visibility matters because it can create useful visits and customer actions. The report should show organic sessions or users, key landing pages, and the actions that represent genuine progress: tracked calls, submitted forms that reached the business, bookings, purchases, or another verified event. Separate total actions from qualified leads and completed outcomes when the sales process supports that distinction.
Google Analytics describes its Traffic acquisition report as a session-based view of where new and returning visitors came from. It can include sessions, engagement, key events, and session key-event rate by source, medium, channel, and campaign. Use the organic channel and landing-page context, but verify that the underlying events still fire and that internal tests, spam, and duplicate submissions are not inflating the count.
A GA4 key event records an action marked as important to the business. That label does not prove the action became a qualified opportunity. Match analytics records to call tracking, form delivery, booking systems, CRM stages, or sales records where available. State the match rule and the number of leads that could not be classified instead of silently dropping them.
If organic leads cannot be separated reliably, make measurement repair the first recommendation. Use the DigitalWiz guide to track where website leads come from and test form receipt with the contact-form delivery checklist.
- Organic sessions and important landing pages
- Calls, forms, bookings, purchases, or other verified actions
- Qualified, unqualified, duplicate, spam, and unknown outcomes
- Source and landing-page match rate
- Tracking tests or changes that affect comparison
Add local search evidence without mixing unlike metrics
For a local service business, include Google Business Profile performance when the profile is part of the search strategy. Google's Business Profile performance documentation lists searches, views, calls, website clicks, directions, messages, bookings, and other interactions that may be available. Only report metrics that apply to the verified profile.
Keep Business Profile calls, website clicks, and direction requests separate from website analytics events. The systems use different definitions and attribution. Google also notes that Business Profile performance can include organic and Google Ads activity. Label the source and avoid adding numbers together unless they represent the same event under a documented deduplication rule.
Review the actual search terms and actions alongside profile changes, reviews, photos, categories, hours, and website destinations. Do not claim a single post, photo, or review caused a visibility change from an ordinary monthly comparison. Record the timing, show the evidence, and label the explanation as a hypothesis when other causes remain plausible.
Record work, risks, and next actions separately
A report should document what changed on the site or profile during the period: pages created or revised, internal links added, technical issues fixed, redirects changed, structured data updated, tracking repaired, and profile edits completed. This is an activity log, not proof that the work caused every movement in the same month.
Create a separate risk section for indexing errors, crawl failures, broken forms, tracking gaps, incorrect canonicals, security warnings, stale profile information, slow templates, or important pages losing visibility. For each risk, include the evidence, affected scope, owner, next check, and whether it blocks measurement or customer access.
End with no more than three prioritized actions. Each action should name the affected page or system, the evidence behind it, the expected user or measurement benefit, the owner, and the due date. 'Improve SEO' is not an action. 'Rewrite the roof-repair title and opening answer because impressions rose while CTR fell for repair-intent queries; recheck the same query/page filter after the next complete reporting window' is testable.
- Completed work: what changed, where, and when
- Open risk: evidence, scope, severity, and owner
- Next action: exact page or system and expected benefit
- Due date and next measurement window
- No causal claim unless the evidence can support it
Use a one-page owner summary and a technical appendix
The owner summary should fit on one page or one screen: goal, period, key outcomes, qualified lead evidence, material search movements, risks, and next actions. Use plain language and link every important statement to a page, query group, lead report, or issue record that someone can inspect.
Put the detail in an appendix: exported Search Console filters, landing-page tables, query groups, Business Profile metrics, analytics definitions, lead-classification notes, crawl results, change log, and unresolved measurement gaps. This keeps the main report readable without hiding the evidence.
Before sending it, run three checks. First, can an owner tell what happened and what decision is needed? Second, can an analyst reproduce the important numbers from the named source and filters? Third, does every recommendation have a reason, an owner, and a date? If not, remove the decorative chart and repair the decision path.
Need a monthly report that connects search visibility, website behavior, and lead quality instead of stopping at rankings? Review DigitalWiz Search Visibility, run a free BizScore audit, or contact DigitalWiz.